
Boulder, United States · 22 September 2025
Arctic sea ice reached its annual minimum extent on 10 September 2025, covering 4.60 million square kilometers (1.78 million square miles) of the Arctic Ocean, according to scientists at the National Snow and Ice Data Center (NSIDC). The figure ties with 2008 and 2010 for the 10th lowest minimum in the 47-year satellite record, which began in 1979.
While the 2025 minimum did not set a new record low — the all-time minimum of 3.41 million square kilometers was recorded in 2012 — NSIDC scientists emphasized that the result remains fully consistent with the long-term trajectory of declining Arctic sea ice. The last 19 years, from 2007 through 2025, represent the 19 lowest September extents in the entire satellite record.
The 2025 Melt Season
The journey to the September minimum began with the annual maximum extent, reached on 22 March 2025, when Arctic sea ice covered 14.33 million square kilometers — the seventh-lowest maximum in the satellite record. From that peak, the ice retreated through the spring and summer months, with the most rapid melt occurring in July and August.
The 2025 melt season was characterized by above-average air temperatures across the central Arctic Ocean and the peripheral seas, particularly the Beaufort, Chukchi, and East Siberian Seas. Warm southerly winds pushed ice edge northward in these regions, while the Northern Sea Route along the Russian Arctic coast remained largely ice-free through the summer — a pattern that has become increasingly common in recent years.
The Laptev Sea, historically one of the first Arctic regions to lose its summer ice cover, again saw near-complete ice retreat. The Greenland Sea and the area north of Svalbard also experienced significant ice loss, though some multi-year ice persisted in the region north of the Canadian Arctic Archipelago — the last refuge of thick, old ice in the Arctic.
Multi-Agency Measurements
Different agencies reported slightly different figures for the 2025 minimum, reflecting variations in data sources and methodologies:
| Agency | Method | Minimum Extent | Date |
|---|---|---|---|
| NSIDC | Satellite microwave radiometers | 4.60 million km² | 10 September 2025 |
| JAXA/NIPR | AMSR2 data | 4.58 million km² | 7 September 2025 |
| USNIC | Interactive Multisensor Snow and Ice Mapping System (IMS) | 4.86 million km² (3-day average) | 21–23 September 2025 |
The NSIDC uses passive microwave data from satellite sensors to estimate sea ice extent, defined as the area where ice concentration exceeds 15%. The U.S. National Ice Center (USNIC) employs a different methodology — the Interactive Multisensor Snow and Ice Mapping System (IMS) — which incorporates additional data sources and uses a 3-day running average, resulting in slightly higher values and a later date. Japan's National Institute of Polar Research (NIPR), using the Advanced Microwave Scanning Radiometer 2 (AMSR2) instrument, reported a minimum of 4.58 million km² on 7 September.
Despite these methodological differences, all three datasets agree on the fundamental picture: the 2025 minimum was well below the long-term average and continued the pattern of persistent Arctic sea ice decline.
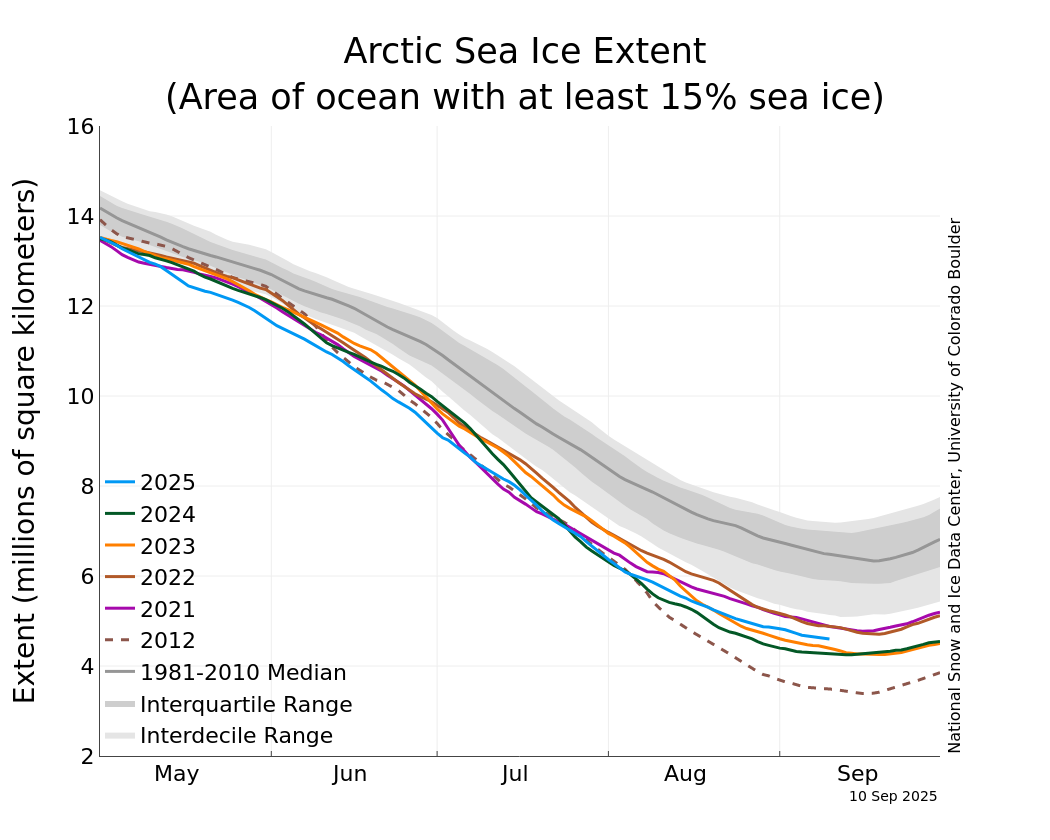
Credit: NSIDC. Time series of Arctic sea ice extent showing the 2025 minimum relative to the 1981–2010 median and interquartile range.
The 19-Year Streak
Perhaps the most striking statistic from the 2025 data is not the minimum itself but the context: every September since 2007 has ranked among the 19 lowest sea ice extents on record. This means that no one currently under the age of 24 has lived through a year with an Arctic sea ice minimum above the long-term average.
The decline in sea ice extent is accompanied by an even more concerning trend: the loss of multi-year ice — ice that has survived at least one melt season and is typically 2–4 meters thick. Multi-year ice has been steadily replaced by thinner, first-year ice that is more vulnerable to summer melt. The volume of Arctic sea ice, which accounts for both extent and thickness, has declined even more sharply than extent since the 1970s.
Drivers of the 2025 Minimum
Several factors contributed to the 2025 melt season outcome:
- Above-average air temperatures: Summer air temperatures across the central Arctic were 1–3°C above the 1991–2020 average, driven in part by persistent high-pressure systems that brought warm air from lower latitudes.
- Warm ocean temperatures: The Copernicus Climate Change Service confirmed that July 2025 saw the highest global ocean surface temperatures on record. Warm waters entering the Arctic through the Bering Strait and the Fram Strait accelerated ice melt from below.
- Atmospheric circulation patterns: The Arctic Oscillation was in a predominantly positive phase during the spring, which tends to flush older ice out of the Arctic through the Fram Strait.
- Early snow melt on land: Snow cover on the surrounding land masses melted earlier than average, reducing the albedo (reflectivity) of the Arctic system and increasing absorption of solar radiation.
Implications for Climate and Ecosystems
The continued decline of Arctic sea ice has cascading effects across the climate system, marine ecosystems, and human communities:
Climate feedbacks: As sea ice retreats, the exposed dark ocean surface absorbs more solar radiation rather than reflecting it — the albedo feedback effect. This accelerates regional warming, which in turn accelerates ice melt, creating a self-reinforcing cycle. The Arctic is warming at approximately four times the global average rate, a phenomenon known as Arctic amplification.
Ecosystem disruption: Arctic species including polar bears, walruses, and certain seal species depend on sea ice for hunting, resting, and breeding. The shrinking ice season forces these species to spend more time on land or in open water, with documented impacts on body condition, reproductive success, and population dynamics.
Indigenous communities: Arctic Indigenous peoples who have relied on sea ice for travel, hunting, and cultural practices for millennia face increasingly dangerous conditions as ice becomes thinner, less predictable, and shorter-lived.
Geopolitical and economic interests: The retreating ice has opened new shipping routes — particularly the Northern Sea Route along Russia's Arctic coast — and has intensified interest in Arctic oil, gas, and mineral extraction, raising environmental and governance questions.
Looking Ahead
NSIDC scientists noted that while year-to-year variability in the minimum extent is influenced by weather conditions during the melt season, the underlying trend is unambiguous: Arctic sea ice is in long-term decline. Climate models project that the Arctic could experience virtually ice-free summers (defined as less than 1 million km²) as early as the 2030s under high-emission scenarios, and potentially by mid-century under more moderate scenarios.
The 2025 result — the 10th lowest minimum, extending the 19-year streak — adds another data point to a record that has become a defining indicator of the Anthropocene.
Sources
- NSIDC,
- NSIDC,
- U.S. National Ice Center,
- National Institute of Polar Research (Japan),
- Copernicus Climate Change Service, July 2025 ocean temperature data
- WMO,
FIRAT Editorial Board
Institutional Research Desk · Foresight Institute of Research and Translation
The collective editorial and research translation board of FIRAT, synthesising peer-reviewed evidence, policy briefs, and division milestones across our seven foundational research pillars.

